Home Blog Page 48

Study: Retirees Struggle To Replace Income

0

The rule of thumb holds that Americans need to maintain 70% of their pre-retirement income after they stop working. If that’s true, then the retirement crisis is even worse than we thought—and it’s worst in the Northeast, the most populous area in the country.

A recent study from Interest.com found that the median incomes of people 65 and older only reach that 70% replacement ratio in one state.

If you’re a retiree in Nevada, congratulations! The study showed that Nevada is the only state where people of retirement age have been able to maintain at least 70% of their pre-retirement income.

Overall, results were mildly encouraging from the perspective of previous studies. The national ratio for replacement leaped to 59.6%, up from 57.4% the last time the study was conducted in 2011. In general, however, the average American has a long way to go if they hope to attain that 70% threshold.

“It’s clear that nearly everywhere in the country, older Americans don’t have the kind of money they need for a secure and comfortable retirement,” said Mike Sante, managing editor of Interest.com.

The average household earns $35,107 per year in retirement, as opposed to the pre-retirement figure of just over $55,000. The information was calculated using the 2013 American Community Survey, conducted annually by the United States Census Bureau.

Most states are inching toward that 70% benchmark, as 28 of our 50 states are replacing between 60 and 69 percent of their pre-retirement income. States that are well-known as retirement destinations performed well—such as the aforementioned Nevada—with Hawaii, Arizona and Florida all finishing in the top 10.

The news wasn’t as good for the country’s most populous area—the northern region of the East Coast. Seven of the bottom 10 states for replacement income fell in this region, including Massachusetts, which finished dead last at a ratio of 48.7%. Several of these states often find themselves near the top of the list in terms of income per capita, emphasizing the importance of careful retirement planning for those who’ve become accustomed to a certain way of living.

Japan Embarks on Quantitative Easing

0

Last week, stocks closed at all-time highs after the Bank of Japan announced surprising stimulus measures. This week, the fallout from that decision continued.

On Monday, the Japanese yen fell to a seven-year low of 114.2 against the U.S. dollar. In other words, $1 dollar U.S. is worth 113 Japanese yen. Just two years ago, the rate was 1 U.S. dollar for 80 Japanese yen. Experts say the trend will only worsen for Japan’s economy.

Additionally, the Japanese government said they’d be putting part of their Government Pension Investment Fund into Japanese and U.S. stocks. Experts expect an additional $200 billion dollars going into the U.S. stock and bond markets.

Brian Kelly—founder of Brian Kelly Capital, an investment firm catering to high net worth individuals—said that the market’s excitement over this stimulus won’t last long.

“What [the Japanese government] did is outrageous,” Kelly proclaimed. “It’s a terrible idea. It’s going to have massive ramifications. The U.S. stock market hasn’t woken up to it yet, but they will.”

Kelly predicted deflation in the United States could be the first consequence of this action. “Eventually, when the levee breaks… it’s going to completely fall apart!” said Kelly.

This week, the surprising news out of Japan continued when the country’s Economic Minister suggested additional stimulus measures, if the 3rd quarter GDP numbers are disappointing. Those numbers won’t be released until next month—but the total public debt is already more than twice the country’s GDP.

Republicans Dominate Election Day, Take Control of U.S. Senate

0

One week ago, predictions on the outcome of Election Day were as numerous as the races themselves. Many pundits believed the Republican Party would seize control of both houses of Congress, while others thoughts the Democrats could maintain a slight majority. Still more predicted a race that was simply ‘too-close-to-call’ and could go to either side.

But of all those projections, few if any foresaw the one-sided outcome that flipped the balance of the Senate—and with it, the U.S. Congress—for President Obama’s last two years in office.

The Republicans dominated the day, turning a 55-45 deficit in the Senate into a 53-46 majority—with one more seat likely to ‘turn red’ in Louisiana. GOP challengers took seats from Democratic incumbents in:

  • Alaska
  • Arkansas
  • Colorado
  • Iowa
  • Montana
  • North Carolina
  • South Dakota
  • West Virginia

The Louisiana race will be decided in a December 6 ‘run-off’, with Republican Bill Cassidy widely expected to upend incumbent Democrat Mary Landrieu. If this comes to fruition, the Republicans would hold a 54-46 majority—a shocking turnaround from the start of Obama’s presidency, when the Democrats held a 58-42 majority.

The party also extended its majority in the House of Representatives to an astonishing 60 seats (with seven races still to be decided.) Like the Senate, this represents an eye-popping reversal from the start of the Obama administration, when the Democrats held a 79-seat majority in the House.

What’s more, GOP gubernatorial candidates scored upset victories in traditionally blue states such as Maryland, Massachusetts and even President Obama’s home state of Illinois. ‘Swing’ state races in Ohio and Michigan also went the way of the Republicans. In fact, perhaps the lone bright spot for the Democrat party came from Pennsylvania, where challenger Tom Wolf unseated Republican incumbent Tom Corbett.

What made the elections so one-sided? Many of the aforementioned predictions believed the Republicans would take control of the Senate, but the ease with which it happened seemed to stun most experts. Did President Obama’s low approval rating spell doom for his entire party?

“I think this was an across-the-board rejection [of Obama’s policies],” said political insider Dick Morris on last week’s Crash Proof Retirement Show. “But also, a lot of union members, blue-collar workers—a number of these voters went back over to the Republican side. A lot of young voters also turned against the Democrats.”

With the midterm elections decided, the countdown is officially on to the 2016 presidential election. Numerous Republican names have been discussed and debated as possible challengers to the incumbent party and their likely nominee, Hillary Rodham Clinton. If last week is any indication, Mrs. Clinton has a long road ahead of her if she hopes to follow in her husband’s footsteps.

Dick Morris Reacts to Republican Victory

0

Internationally renowned political insider Dick Morris reacts to the Republican victory in the mid-term elections. Morris is now on the campaign trail fighting to prevent the Democrats from another presidential election victory.

Dick Morris will be speaking at Crash Proof Retirement Educational Events throughout the tri-state area and your opportunity to meet him awaits at www.CrashProofRetirement.com

Tune in to the Crash Proof Retirement Show with Phil Cannella, Joann Small, and Dick Morris every Saturday from 11am – 1pm on Talk Radio 1210.

Mid-Term Elections Will Dictate Obama’s Legacy

0

Today, the American public is focused on the mid-term elections—and rightfully so. All 435 seats in the U.S. House of Representatives are up for grabs, as are one-third of Senate seats. In addition, 36 of 50 states will have their governorships determined Tuesday.

These elections will go a long way towards determining the direction of Barack Obama’s last two years in office, and as always that outcome will be reflected by the stock market.

The biggest mystery surrounding Election Day is the makeup of the United States Senate. The Democratic Party currently enjoys a 53-45 majority in this branch, plus two Independent members who caucus with the Democrats and are therefore considered a part of the majority. That means that out of the 33 seats contested next week, the Republicans need to take six additional Senate seats to enjoy control of both branches of Congress (the Republicans already hold a 33-seat majority in the House, which they are widely expected to maintain after the elections.)

Why is this significant? The last three two-term presidents (Ronald Reagan, Bill Clinton, George W. Bush) both presided over similar disbursements of Congress—meaning the controlling party was opposite of their own. Most troubling of all, however, is that all three Presidents oversaw significant downturns or stagnation in the market during those final two years in office.

Why? Explanations are numerous. It’s obviously harder to get anything accomplished in Washington, D.C. when the legislative and executive branches are in direct conflict. Some believe this is only compounded when an outgoing President is in his last two years, no longer concerned with running for re-election and instead focused on cementing his legacy.

Whatever the case, as the old saying goes—“once is an accident, twice is a coincidence… three times is a trend.” (or pattern, or proof.) Retirement Media Inc. looked at these three Presidents, their last two years in office and the surrounding conditions that may have determined market direction during those times.

Ronald Reagan: President from 1981-1989 (Party: Republican)

Controlling Party of Congress for last two years: Democratic (55-45 Senate; 258-177 House)

Market Summary: On the surface, the Dow Jones numbers look pretty appealing to investors: almost 15% in gains over the last two years of the Reagan era. However, consider the following:

  • In Reagan’s first six years, the Dow Jones Average nearly doubled (from 950 on Inauguration Day 1981 to 1,877 on Election Day 1986.) By comparison, a 14.8% return over the final two years appears rather paltry.
  • That initial pace of growth may well have been sustained if not for the most catastrophic single event in Wall Street history since the Great Depression—Black Monday, chronologically known as October 19, 1987. On that single day, the Dow shed almost a quarter of its total value, dropping 508 points during the session. From its August 25, 1987 high of 2,722; the Dow dropped almost 1,000 points to 1,738 by the end of Black Monday—a drop of over 36% in less than two months!
  • Needless to say, Black Monday scared plenty of investors off the markets altogether—it was an event that was literally unprecedented in many of their lifetimes. These people had seen many of their Reagan Era gains wiped out in a single day—and as a result, were not on the market to participate in the recovery. On Wall Street, sometimes all it takes is one bad day.

Bill Clinton: President from 1993-2001 (Party: Democratic)

Controlling Party of Congress for last two years: Republican (55-45 Senate; 223-211 House)

Summary: There’s no questioning that President Clinton oversaw the greatest eight-year run in stock market history. From his 1993 inauguration until the end of his term, the Dow Jones Average more than tripled, growing from 3,241 to almost 11,000. Again, however, the momentum began to slow towards the end of his term. If you experienced 169% growth in a six-year period, a figure like 24% growth in the ensuing two years might leave you feeling a bit underwhelmed.

But imagine the reaction of people who lived through the Great Depression if they heard complaints about money only growing 24% in two years! Therefore, let’s focus on the events during those last two years that led to the early 2000s recession. This downturn is typically known as the Crash of 2001-2002—however, the reality is that it began in 1999 and 2000, the final years of Clinton’s administration.

A stock market bubble occurs when a rise in stock prices is created by a factor that is only tangentially related to the economy overall. Many companies, as a result, become greatly overvalued. Unfortunately, it’s often hard to identify a ‘bubble’ until it’s already burst. This was the case with the dot-com bubble, which started in the mid-late 1990s as startup companies took advantage of low interest rates to attain skyrocketing amounts of capital.

Through 1999 and early 2000, the Federal Reserve increased interest rates six times. The easy money dried up, and the bubble burst on March 10, 2000. The day before, the NASDAQ index had reached its all-time high (5,048.62). Nine days later, the index had declined more than 10% off of its high.

Meanwhile, the Dow Jones Average had attained an all-time high of 11,722.98 on January 14, 2000. But investors must have sensed trouble, as the market had dropped a full 20% by March 8, 2000—two days before the dot-com bubble burst.

The rest, as they say, is history. The stage was set for a bear market that would last more than three years. From that January 2000 high of 11,722.98, the Dow would fall as low 7524.06 by March 2003—a crash of 36%. And it all started with the dot-com bubble of the mid-late 1990s.

George W. Bush: President from 2001-2009 (Party: Republican)

Controlling Party of Congress for last two years: Democratic (51-49 Senate; 236-199 House)

Summary: President Bush’s administration ushered in the new era of stock market volatility. He took office at the start of the early 2000s Crash, guiding the country through the tragic events of 9/11 in the first year of his term—then enjoyed several prosperous years from 2003-2007. But the worst, as we all know, was just around the corner.

No one needs much of a refresher of the Great Recession, but here are the numbers: from a high of 14,164.53 on October 9, 2007, the Dow Jones Average would lose a staggering 54% of its value over the next 17 months, not bottoming out until it reached 6,547 on March 9, 2009—two months after President Bush had left office. The S&P 500 declined slightly more, a loss of 57% over the same time period.

When all was said and done, the United States had seen the worst financial crisis since the Great Depression.

Will President Obama be able to avoid this disturbing trend? He’s facing the same obstacles as his three predecessors:

  • He’s in the last two years of his administration
  • The market has been quite prosperous for most or all of his presidency
  • The House has a clear majority of Republicans, while Obama is Democratic

All that’s left to determine is the Senate. Tuesday could tell us a lot about the market direction of the next two years.

Quantitative Easing Is Over — What’s Next?

0

Last week, the Federal Reserve announced the end of the third leg of quantitative easing, or QE3.

QE3 lasted for over two years, with the Fed buying between $40 billion to $85 billion in mortgage-backed securities each month. This number was tapered to $25 billion in August.

The greatest ‘side effect’, so to speak, of quantitative easing has been a run-up in the stock market that has coincided with each phase. In the 2+ years of QE3, the Dow has broken its previous all-time high 40 times, most recently on October 31. Its current level of 17,390 is about 26% higher than it was at the start of QE3.

So what is to become of the market at the end of QE3? We looked back at phases 1 & 2 for some insight:

Quantitative Easing Phase 1

This was the original inception of the program, implemented in response to the financial crisis of 2008. Beginning in November of that year, QE lasted a total 16 months and saw the government purchase about $1.4 trillion in debt and mortgage-backed securities.

Effects on the Stock Market: Over the 16-month life of QE1, the Dow Jones Industrial Average (DJIA) grew a total of almost 2400 points, or 28%. This information is even more impressive when you consider the DJIA continued its decline for the first three months of the program—meaning over the last 13 months, the Dow grew a whopping 66%!

Aftermath: QE1 wrapped up on March 31, 2010, and by July 1 the Dow had sustained a 14% drop. Undeterred, the Fed announced that phase 2 of quantitative easing would begin that fall.

Quantitative Easing Phase 2

Beginning in November of 2010, the Fed announced this phase of quantitative easing would promote a more sustained economic recovery. It lasted only half as long as phase one—eight months—but added another $600 billion in securities purchases.

Effects on the Stock Market: It wasn’t as pronounced as phase one, but considering the shorter time period, investors did quite well for themselves during the eight-month duration of QE2. By the time the program wrapped up on June 30, 2011, the Dow was up about 12%.

Aftermath: Almost immediately, the bottom dropped out of the stock market. Within six weeks, the market had dropped 16% amidst fears about the national credit rating.

Quantitative Easing Phase 3

Phase 3 wouldn’t begin until September 2012, but it has been by far the longest, most sustained attempt to stimulate the U.S. economy. Originally, it was announced that monthly purchases would total $40 billion, but that number would ultimately grow as high as $85 billion per month.

Effects on the Stock Market: The Dow Jones Industrial Average set 40 all-time highs over the life of QE3, the latest (and highest) occurring on its final day, October 31, 2014, when it closed at 17,390. That’s a 28% increase in almost exactly two years.

So what will be the aftermath to the conclusion of QE3? Both of the first two phases saw immediate market corrections within 45-90 days. If that trend holds true a third time, are you prepared to sustain another loss on Wall Street?

Market Watch: Brutal October Continues

0

In recent days, the buzzword on the markets has been volatility. After today, there’s no getting around the truth—the market is in the midst of a full-fledged selloff.

It was an historic day for all the wrong reasons.

Wednesday Closing Bell

Dow Jones Industrial Average:  16,141.74 (-173.45)

S&P 500:  1862.49 (-15.21)

NASDAQ: 4215.32 (-11.85)

Among the lowlights:

  • The NASDAQ index briefly crossed into correction territory (defined as a 10% reversal) before recovering some of its losses.
  • 10-year Treasury rates dipped below 2% for the first time since May 2013, falling as low as 1.91% before closing at 2.09%.
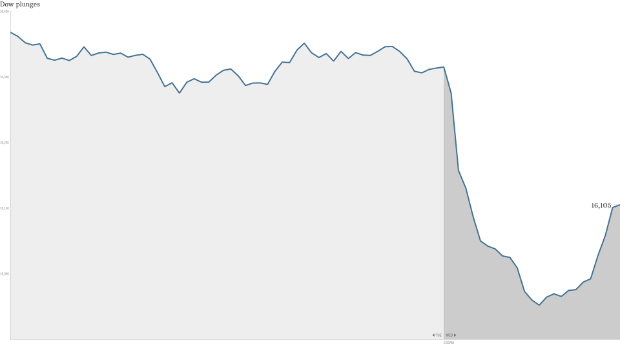
  • The Dow Jones Industrial Average moved a whopping 628 points in the first 30 minutes of trading today, the 5th consecutive daily drop. In those past five days, the Dow is down 5.02%.

The usual suspects—European struggles, Ebola virus concerns, and oil prices—were to blame for the awful session. A general lack of liquidity was the reasoning behind the early-morning ‘flash crash’ of 360 points. Stocks rallied considerably, only to fall back to session lows in the lunchtime hour, and break through to a new low (down 459 points) around 1 p.m. Eastern time.

Healthcare stocks were particularly hard-hit, in the midst of the ongoing Ebola virus scare. Moreover, airline stocks took a hit upon news that one of the healthcare workers infected with the virus was a flight passenger one day before receiving her positive diagnosis.

But despite the health scares, many investors insisted that Ebola was a ‘secondary’ concern; that the majority of the selloff was a result of continued struggles in the main European markets—each of which closed down 2% or more Wednesday. This was led by the Greek market, which was smashed to the tune of a 6.25% downturn. A double-whammy of political and economic woes created a perfect storm for a devastating day.

Add it all up, and you have each of the three major U.S. indexes circling closer to correction territory. Below are the percentages by which each index is off of its recent high. (Remember, 10% signifies a full correction.)

Dow Jones  6.59%

S&P 500 -7.48%

NASDAQ  -7.81%


Market Watch: Wednesday Woes Send Major Indexes Plummeting

0

It’s out of the frying pan and into the fire for Wall Street today.

After limping away from the last days of September, stocks took another big hit today as the Dow fell over 240 points and the S&P dipped another 1.3%. As of 2:00 p.m. today, the losses on this first day of October equaled those for the entire month of September—traditionally, the worst month in the market.

Most analysts were quick to blame geopolitical woes. Between fears stemming from ISIS, Ukraine and the first confirmed case of Ebola here in the United States, this seemed to be the simplest solution. But the concerns on Wall Street go much deeper.

October has long been targeted as the end of the Federal Reserve’s latest round of quantitative easing, an event many feared would send the market into a tailspin. For today, those prognostications appeared prophetic, although the official ends of the programs is still a few weeks away.

Key economic data and the impending start of third-quarter earnings season only added to Wednesday’s unrest.

“When Alibaba was introduced, the market should have gone higher, but it didn’t,” Virtus Investment Partners Senior Marketing Director Joe Terranova told CNBC. “Since that week, there’s been reason to be worried.”

So where does it all end?

“I don’t think this correction ends until we have a [day where the Dow goes down 500 points],” Terranova concluded. “And I think the potential for that is there in the next month.”

Market Watch: Stocks Hit Hard By Global Unrest, Tech Worries

0

Thursday was ripe with worries on Wall Street, the result of which was a drop of 264 points on the Dow and the S&P 500 falling more than 1.5% by market close.

Early analysis held that the plummet was attributed to concerns over worsening relations between the United States and Russia. Reports surfaced that the Kremlin was considering a measure that would allow its courts to seize foreign assets.

But as the day went on, much of the drop in prices was limited to the tech sector, led by Apple dropping over 3% in less than an hour. Ongoing user problems with the new iPhone 6 were to blame.

The Chicago Board Option Exchange (CBOE) Volatility Index leaped almost 18% throughout the day—no surprise, as volatility has been the common theme on Wall Street this week. Monday and Tuesday each saw triple-digit drops in the Dow, followed by a 150-point rebound on Wednesday. But the recovery was washed away –literally—on this rainy Thursday.

As of the start of business Friday, the Dow is down over 150 points for the month of September.

Senator Elizabeth Warren Calls Out Wall Street Again

0

At the beginning of the month, former House Majority Leader Eric Cantor took a lucrative new role at Moelis & Co., a New York-based investment bank. The move, announced the day after Labor Day, seemed hasty—only two weeks after Cantor’s resignation from Congress. Suggestions abounded that the hope was to avoid widespread attention to Cantor’s sudden career change.

Better luck next time.

In a scathing editorial for The Huffington Post, Senator Elizabeth Warren (D-MA) lashed out at the continual blurring of the lines between finance and politics, explaining that Cantor’s new job is just the latest manifestation of the collaborative relationship between Wall Street and Washington, D.C.

“Cantor has little experience in financial services,” wrote Senator Warren, “and the value of people like him to Wall Street firms is influence peddling, plain and simple.”

Warren admitted that her opposition to Wall Street’s influence in the nation’s capital is nothing new. However, what drew her ire this time was a corresponding editorial by former Representative Anthony Weiner. Identifying himself as a fellow “member of the fighting wing of the Democratic party”, Weiner nonetheless called Senator Warren’s criticism of Cantor ‘overblown’ and ‘petty’.

“I’ve talked about [Wall Street’s influence] for a long time—long before I even thought of running for office,” wrote Senator Warren. “But when I see a problem… a lot of others in Washington, both Democrats and Republicans, seem to see government working just fine.”

Some of the highlights of Warren’s argument—which can be read in its entirety here—were the following:

  • Pointing out that three of our last four Treasury secretaries under Democratic presidents held high-paying jobs with Citigroup before or after leaving the Treasury—while the 4th secretary turned down Citigroup’s CEO role.
  • Another former member of Congress, Democrat Melissa Bean, recently filled the position at JPMorgan Chase that was vacated by former White House Chief of Staff Bill Daley.
  • In the year 2009, almost 1,500 former federal employees were engaged in lobbying efforts for the financial services sector. Among them were some 73 former members of Congress.

Senator Warren concluded the editorial with an appeal to get Washington working for families rather than corporations; for policymaking rather than profits; and for the common man rather than for those who can hire armies of lobbyists. But above all, she made it clear that her words were not a personal attack on her former colleague.

“Eric Cantor isn’t the exception—he’s the rule,” she wrote. “The ties between Washington and Wall Street run deep.”

Recent Posts

The Impact of Repealing the Glass-Steagall Act

In the leadup to the “Black Tuesday” Stock Market Crash of 1929, and Banking Collapse of 1933, lax financial regulations created an...
retirees returning to work

Study: 40% of Retirees Plan to Return to the Workforce in 2024

In today's society, a significant amount of retirees are finding themselves living at or below the poverty level. This phenomenon is largely...

THIS WILL CHANGE EVERYTHING

Crash Proof Retirement has announced that they have taken a bold step in 2024 by recording and...
The Investment Gender Gap: Women Feel Ignored by Financial Advisors

The Investment Gender Gap: Women Feel Ignored by Financial Advisors

In March, we observe Women’s History Month to recognize and celebrate the vital role that women have played in shaping American history....

Adjusting Your Investment Strategy as You Age

There are three phases that every investor goes through as they make investment decisions during their life. While it would seem logical...

Most Popular

The Impact of Repealing the Glass-Steagall Act

In the leadup to the “Black Tuesday” Stock Market Crash of 1929, and Banking Collapse of 1933, lax financial regulations created an...
retirees returning to work

Study: 40% of Retirees Plan to Return to the Workforce in 2024

In today's society, a significant amount of retirees are finding themselves living at or below the poverty level. This phenomenon is largely...

THIS WILL CHANGE EVERYTHING

Crash Proof Retirement has announced that they have taken a bold step in 2024 by recording and...
The Investment Gender Gap: Women Feel Ignored by Financial Advisors

The Investment Gender Gap: Women Feel Ignored by Financial Advisors

In March, we observe Women’s History Month to recognize and celebrate the vital role that women have played in shaping American history....

Adjusting Your Investment Strategy as You Age

There are three phases that every investor goes through as they make investment decisions during their life. While it would seem logical...