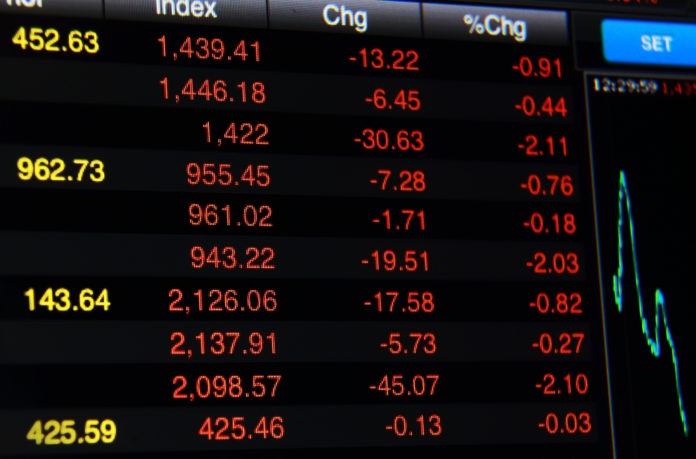
Many Wall Street experts have spent the summer calling for a market correction. Some call for a 5-10% reduction, while others such as Marc Faber have called for a 20-30% crash.
The truth is that no one knows when the next market correction or crash will happen, nor do they know how significant it will be. But history tells us that it will happen one way or another.
According to Business Insider, corrections (defined as a drop in a particular index such as the S&P 500 of 10% or greater) occur once every 1.5 years, or every 357 trading days. It’s been just about twice as long since the last such event in this market. The most recent correction occurred in the summer of 2011 in the wake of uncertainty in European markets as well as the downgrading of the United States’ credit rating.
Extended correction-free periods aren’t unheard of—but that may be the most worrisome factor of all. Beginning in April 2003, the market experienced no corrections for a whopping 54 months, building up to a then-all-time high on October 9, 2007. Thirteen months later, the S&P 500 was slashed in half by the 2008 crash.
So how will investors know when the correction is beginning? That’s a hard question to answer. The past couple months have been filled with what appeared to be indications of a downward trend, including geopolitical tensions in Ukraine and the Middle East, plus a full 2% drop of the S&P 500 in one day (July 31).
A common means of identifying an impending correction is by setting a support level. Support levels are loosely defined as a number that stocks or index values are unlikely to fall below. If a security or index falls to this level, it’s seen as a test. If buyers begin purchasing the stock at this level, then it’s been supported. If there’s no change in buyers—or worse, a continued selloff—the stock has lost support.
These support level numbers are typically taken from “moving averages”—the mean number at which an index has closed over a set time period of 100 or 200 days.
Of course, it’s difficult to target a precise number as a breaking point for a moving average since by definition, the figure changes daily. But in a bull market, the average is steadily increasing—as is the case right now. Regardless, one school of thought holds that if prices fall below their 200-day moving average, it signifies a reversal of an upward trend in the market—in other words, a correction.
Right now, the S&P 500 is 70-80 points higher than its’ 200-day moving average—but as the average creeps higher, it will be interesting to see whether prices will support that figure. When they don’t, it can be the surest sign of an imminent correction.


