Home Blog Page 49

Improving Economy? Not According To These Signs

0

Cause and effect—it’s one of the first things we learn as children. But few people truly understand its meaning, which can become the source of all kinds of trouble.

The economy is a perfect example. Just because the stock market keeps reaching or approaching all-time highs does not mean the United States economy is thriving. In fact, in recent weeks several indicators have pointed to a continued economic struggle as the nation deals with the ongoing recovery from the 2008-2009 crisis.

Mortgage applications fall to 14-year low: The Mortgage Bankers Association (MBA) reported that total applications fell 7.2 percent last week, dropping their weekly index to a 14-year low. Purchase applications are also down 12 percent from last year’s level.

Experts blame this drop on multiple factors, which we’ll examine next.

Low Wage Growth: According to a survey released last week by compensation consultant firm Towers Watson, the average worker can expect a raise of about 3 percent in 2015. That’s in line with the average number of 2.9 percent reported in 2012 and 2013, but the expected numbers barely outpace inflation, currently running at 2.1 percent.

Calling the numbers ‘disappointing’, the study said companies are falling short of certain incentive programs, and are not basing pay increases on performance to the degree they have in the past. What’s more, of the 32,000 workers who were surveyed, only 40 percent said they believed their raises—or lack thereof—were commensurate with their performance.

Disappointing Jobs Report: Perhaps the biggest economic news of the week has been the most disappointing of all—only 142,000 jobs were added in August, shocking experts who’d predicted 225,000 new hires. This continued the summer-long trend of decline, starting with 267,000 new jobs in June, 212,000 in July all the way down to August’s 142,000 figure—the lowest in 2014.

Some experts expressed hope that the number could be revised with teachers returning to work towards the end of the month, but agreed the troubling decline was too drastic to ignore.

So while the daily stock figures may paint a rosy picture, the overall economic climate is much cloudier. Investors are left to wonder how long it will be until Wall Street follows suit.

Study: U.S. Stocks Will Drop 30%+ In The Next Five Years

0

All good things must come to an end. Even Wall Street isn’t immune to this old adage.

A new study by Swiss financial consultants Wellershoff & Partners concluded that the U.S. stock market is likely to take a tumble of at least 30% at some point in the next five years.

What makes this study any different than any other analyst predicting a big drop—or a big increase—in stocks? There’s some pretty impressive statistical analysis behind this projection.

Since the 1980s, investors have championed the concept of studying long-term moving averages of P/E ratios to correctly value the stock market. P/E, or price/earnings ratios are calculations that use a company’s current stock price divided by recent earnings.

One-year earnings, experts argue, are simply too unpredictable to offer an accurate long-term picture. But when earnings are distributed over a longer period—10 years is the benchmark—an analyst can better forecast future price movements. Last year, American economist Robert Shiller won the Nobel Prize largely due to his work in furthering this idea.

The concept, known in the industry as cyclically-adjusted P/E (CAPE) ratio, found that as of the study’s publication date in late July, the market stands at a CAPE reading of 25.69 (it has since risen to 26.1). Either way, that’s one of the highest levels in recorded history, and 55-57% higher than the average historical reading of 16.55.

Sounds great, right? GuruFocus looked at historical CAPE ratios in six-month increments since 1881. Let’s take a look at times throughout history when the CAPE ratio has risen to the current level:

1.)    January-July 1929 (CAPE Ratio 27.3): This was the first time the ratio climbed above the current marker of 26.1. Unfortunately, any momentum generated by this accomplishment was overshadowed by the events of that October—known as the start of the Great Depression.

2.)    January-July 2000 (CAPE Ratio 43.0): It took more than 65 years for the CAPE to approach those lofty heights again, but it reached 26.7 in early 1997 and continued to climb to an unprecedented 43.0 by early 2000. However, starting in January 2000, the market took what would be ultimately a 40% downturn over the next three years—slicing the CAPE ratio in half.

3.)    January-July 2007 (CAPE Ratio 26.8): It didn’t take long for the ratio to climb back above the 26.1 mark, peaking in mid-2007 at 26.8. What came next? The years 2008 and 2009 are still reviled on Wall Street, as the S&P 500 saw a 56% crash over 17 months.

So here we are again, with extraordinarily high CAPE ratios. But the Swiss economists aren’t fooled, pointing out the high correlation between these figures and impending market crashes. “Thus, at least for the U.S. market, it seems fair that the risk of losing capital is substantial,” read the study.

They say that those who don’t learn history are doomed to repeat it. Hopefully, investors will heed the warning this study offers and get out before it’s too late.

Guaranteed Investments? Don’t Be So Sure

0

For years, investors have lamented the all-profit nature of the financial industry. Whether or not your investments make money, your advisor charges you a fee. In other words, even if the company loses your money, you owe a fee for their ‘services.’ What other business operates this way?

Recently, investment firms such as TD Ameritrade Inc. and Charles Schwab Corporation decided to change that by offering a full refund of fees to customers whose investments depreciate in value. But no legislation or policy addition led to this change. This was a business decision, not a requirement. So what’s in it for these companies?

Regulators approved a plan under which TD Ameritrade investors would receive their money back on all applicable fees in their Amerivest-managed accounts—between 0.3% and 1.25% annually—if those accounts posted negative returns for two consecutive quarters.

“It’s a program by which we hope more people will try Amerivest if we remove one level of doubt or concern,” said spokesman Joseph A. Giannone.

On the surface, it’s brilliant—entice consumers by offering a layer of protection against losses. But let’s look a little closer. The stipulation of two consecutive losing quarters means you’re looking at a period of six months. While fees certainly take a chunk of any account, if you lose 10-15% over any six-month period, how much reassurance does a 1% reimbursement of fees offer?

Dig a little deeper and you’ll find that nothing is guaranteed. TD Ameritrade’s competitor, Charles Schwab Corporation, unveiled a program late in 2013 aimed at ‘guaranteeing accountability’ that allowed some clients to request a refund “if, for any reason, they are not happy.” As of last week, Schwab reported receiving 550 requests for refunds—less than 1% of all eligible accounts. Either they have VERY satisfied customers, or savvy consumers have deduced that the rebate request is futile. (No information was available on how many of the requested refunds were actually fulfilled.)

Lastly, many industry followers are calling into question the consistency of rules and regulations enforcement on Capitol Hill. Many fear that advisors will pull out all the stops to avoid those consecutive losing quarters that would trigger a potential refund. This means adjusting your portfolio, which leads to greater—and more frequent—transaction fees. But as long as the ‘new’ investment doesn’t lose money, the advisor’s upheld his end of this deal. (Notice there’s no promise or even implication of making money.)

Before you run out to Wall Street and create an account that you’ve been told is ‘guarded’ against losses, consider this: these institutions have thrived for years in an environment that offers them—not you—guarantees. Regardless of performance, they’re guaranteed a percentage of your account each year. Why would brokerages voluntarily sacrifice this perk?

The Cruelest Month?

0

What’s the worst month for the stock market historically?

Most people (including myself) probably would’ve guessed October. For example, I knew the Great Depression was highlighted by a late-October tumble in stock prices back in 1929. I know that “Black Monday” occurred in October of 1987. And I remember October as the month when the 2008 downturn went from ‘concerning’ to ‘oh wow, this is serious.’

So it was surprising to find a site that tracks S&P performance since 1950, proving that October is actually a net-positive month for the market. That’s the good news.

The bad news? Its’ immediate predecessor, September, is historically the worst month for stocks. Since 1929, the Dow Jones Industrial Average (DJIA) and S&P 500 have each dropped an average of -1.1% in September.

Why? Different analysts have offered several explanations—draw your own conclusions:

Return to Work. The third quarter of the year begins with July and August, the time of year when most American families (and traders) take their vacation, declining trading volume and making it much more difficult to forecast impending economic events. Cautious investors return to work and sell off stocks, preferring to take a ‘wait-and-see’ approach.

End of Fiscal Year. Many mutual funds see their fiscal years draw to a close on September 30, leading to a sell-off of underperforming securities just in time to file that final report.

Mood/Attitude of Investors. The weather turns cooler, kids are back in school, days are growing shorter. September is the end of summer, typically seen as the light-hearted, relaxed time of year.

“There is this kind of negative vibe out there that tends to accentuate any negative events,” Dan Seiver, a finance professor at San Diego University, said to the Associated Press.

Whether you buy these explanations or not, the September phenomenon has been known for some time—in 2011, Mark Hulbert of MarketWatch pointed out that research has been ongoing for years about this trend. Once such a pattern is known and widely recognized, Hulbert argued, investors find ways to exploit it and eventually reverse the trend. But since such studies began, the gap between September’s performance and that of other months has actually widened.

Lastly, the trend has been remarkably consistent. In each of the nine decades examined, September’s cumulative performance has never ranked higher than 9th among the twelve months of the year. And it’s been dead last in five out of those nine decades.

So enjoy the last weeks of summer—and the current growth in stocks. But when the calendar changes, maybe your portfolio should follow suit.

More than 1/3 of Americans Have ‘Nothing’ For Retirement

0

On last week’s Crash Proof Retirement Show, political insider Dick Morris and former Federal Reserve official Andrew Huszar joined Phil Cannella and Joann Small for a panel discussion entitled “Is There A Retirement Crisis In America?” The panelists agreed that there is indeed such a crisis, and now research is backing up their opinions.

A recent study from Bankrate.com found that more than 1/3—36% to be precise—of Americans have saved virtually nothing for retirement. The survey polled people from age 18 to those 65 and older.

The survey also examined retirement savings by age group. Of those who answered the survey, 14% of Americans age 65 or older admitted they have less than $1,000 saved for retirement, compared with:

  •  26% of people between ages 50-64
  •  33% of people between ages 30-49
  •  69% of people between ages 18-29

Other eye-popping statistics included the fact that 60% of workers across all age groups have saved less than $25,000 towards retirement. Cost of living and day-to-day expenses were the two most common reasons given for neglecting their golden years.

While the survey found that many younger Americans are starting to turn an eye towards retirement savings at a younger age, the number of people who are uncomfortable with their level of savings doubled from 16% to 32% since last year’s analysis.

“Month in and month out, consumers sound a dour tone about how they feel about their overall level of savings,” said Greg McBride of Bankrate.com. “Many people know they are under saved—whether it’s for emergencies, retirement or both.”

Who Bet $2 Billion on a Stock Market Collapse?

0

For weeks, so-called experts have battled back and forth over whether the stock market will continue to reach new highs, or if it will come crashing down in the next few months. Now, one of the world’s most respected investors has decided to put in his two cents—only in this case, it’s his two billion dollars.

George Soros has spent a lifetime as a trader and analyst. His Quantum Fund is widely recognized as the most successful hedge fund in history. In the 1990s he earned the moniker “the man who broke the Bank of England” when he short-sold the equivalent of $10 billion in pounds. In May 2008, his book The New Paradigm for Financial Markets spoke of a ‘super-bubble’ that would soon burst. The stock market collapse dominated headlines later that same year.

When George Soros talks, the financial world listens.

This time, Soros is putting a significant chunk of money where his mouth is. His most recent 13-F filing (a form required by the SEC of any institutional investment manager with discretion over $100 million or more in securities) showed an increase of over 600% in Soros’ short position against the S&P 500. His total position rose to $2.2 billion, or 17% of his vast portfolio.

A short position occurs when Investor A borrows shares from a broker and sells them on the open market to Investor B. The borrowed stock must eventually be re-purchased (by A) and returned to the broker. If the stock falls in price in the interim, Investor A buys back the stock (from B) at a lower price than he sold it, thus turning a profit. In simple terms, Investor A is betting that the stock’s price will fall, whereas Investor B expects the price to rise.

But Soros hasn’t sold an individual stock—he placed an option on an S&P 500 exchange-traded fund (ETF). He’s betting that the collective stock values of the 500 large companies that comprise that index will take a tumble in the near future. This approach allows him to sell his options—all 11.3 million of them—at a profit, should the market fall.

Investors pay close attention to these 13-F filings—which occur quarterly—to see where the ‘smart money’ is heading. Historically, George Soros has been at the head of the class. Who’s willing to bet against his $2.2 billion?

Market Watch: Stocks Slide To Finish Week

0

The positive feelings on Wall Street were wiped out in a mere hour this morning, as stock prices tumbled in the wake of a double-dip of bad news.

At one point, the Dow was down 130 points for the day. Prices made some recovery before the close of business, but the morning damage was enough to cast doubt over what had been Wall Street’s best week since early summer.

Friday Closing Bell

Dow Jones Industrial Average:  16,662.91 (-0.30)

S&P 500:  1955.06 (-0.01)

NASDAQ: 4464.93 (+0.27)

Experts warned of geopolitical concerns threatening the market for several days. Their predictions finally came true when Ukrainian forces confronted a Russian convoy early this morning. Meanwhile, consumer sentiment in the U.S. fell to a nine-month low.

The result was a triple-digit dip in the Dow by lunchtime, wiping out almost all year-to-date gains. By the end of the day, some of those losses were recouped, but not enough to sustain the week’s upward momentum.

The Russian armored column crossed the Ukrainian border during the night, triggering an almost instantaneous reaction from Ukrainian forces. This morning, a spokesman for the Ukraine spoke of taking ‘appropriate action’ and boasted that at least part of the Russian group ‘no longer exists.’

Meanwhile, the preliminary consumer index reading registered a 79.2, a full three points below its projected level and the lowest reading since last November.

Steering Clear of IRA Mistakes

0

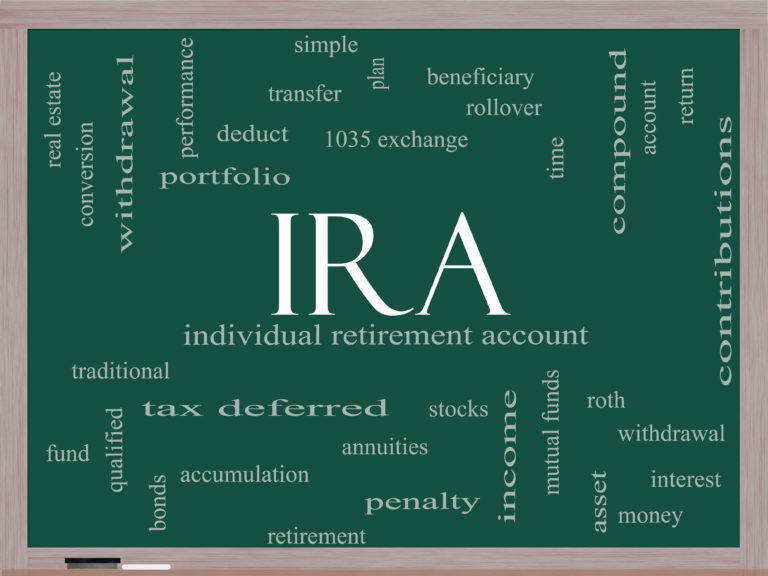
Over the past few decades, the baby-boomer generation has been at the front of the transition from pension plans to personal contribution style retirement saving accounts. Among other benefits, each individual now enjoys greater control—and more options—in accumulating assets for retirement.

But with these opportunities comes an additional burden. People must take greater responsibility for financial decision-making by educating themselves as to the rules governing 401(k) plans and IRAs—or risk depletion of the funds they’ve worked hard to amass.

Luckily, the financial industry is becoming more specialized with retirement phase experts who can help to navigate this tricky course. But that doesn’t mean people planning for retirement always make the right decisions. Here are a couple of the biggest mistakes in managing your 401(k) or IRA—and some alternatives to protect your assets:

The mistake: Early withdrawal—If you take a withdrawal from an IRA account before age 59 ½, you are immediately subject to a 10 percent penalty on the funds taken—plus income tax. For example, a 55-year old in a 25 percent tax bracket would expect to pay $3,500 in penalties and taxes on a $10,000 IRA withdrawal.

The solution: Aside from the obvious “don’t touch that money until you’re 59 ½” there are circumstances under which you could take an early distribution and not be penalized. These include:

  • Using funds to pay for your—or your child/grandchild’s—college education
  • Buying your first home
  • Certain medical expenses

Be advised, however, that these funds will still be taxed—just not subjected to the 10% penalty.

The mistake: Active account management—Managers may offer advice and promise sound investment decisions, but how can an investor trust that the manager is acting in their best interests? A recent U.S. News article reported that the Government Accountability Office (GAO) conducted recent studies of eight account managers. After giving each manager a profile of a hypothetical participant, the researchers found that all of the managers chose different options and balancing intervals—for the same participant!

“Some participants cannot be assured that they are receiving impartial managed account services or are able to rely on investment professionals taking on appropriate fiduciary responsibilities,” GAO reported.

Add in the management fee—which can approach a full 1% each year—and investors need to determine whether active management will help or hinder their long-term goals.

The solution: Numerous options exist for the educated investor that will allow you to manage your own 401(k) account. Perhaps the greatest value to such an approach is the avoidance of fees. On top of the 1% per year that account managers can charge, active managers tend to choose—surprise—actively managed mutual funds! These lead to higher expense ratios.

It would be one thing if active management led to high returns, but even Morningstar has admitted that low cost is the strongest indicator of mutual fund performance.

The best advice is to learn the ins and outs of 401(k) plans and IRAs. Retirement phase experts can offer the resources and materials to help you attain the knowledge you need. Spend a little time now, and you’ll save a lot of money later.

DISCLAIMER: Retirement Media Inc. does not sell or recommend financial products of any kind. The contents of this article are to be used purely for informational purposes. Consult a qualified professional.

The Start Of A Market Correction?

0

Many Wall Street experts have spent the summer calling for a market correction. Some call for a 5-10% reduction, while others such as Marc Faber have called for a 20-30% crash.

The truth is that no one knows when the next market correction or crash will happen, nor do they know how significant it will be. But history tells us that it will happen one way or another.

According to Business Insider, corrections (defined as a drop in a particular index such as the S&P 500 of 10% or greater) occur once every 1.5 years, or every 357 trading days. It’s been just about twice as long since the last such event in this market. The most recent correction occurred in the summer of 2011 in the wake of uncertainty in European markets as well as the downgrading of the United States’ credit rating.

Extended correction-free periods aren’t unheard of—but that may be the most worrisome factor of all. Beginning in April 2003, the market experienced no corrections for a whopping 54 months, building up to a then-all-time high on October 9, 2007. Thirteen months later, the S&P 500 was slashed in half by the 2008 crash.

So how will investors know when the correction is beginning? That’s a hard question to answer. The past couple months have been filled with what appeared to be indications of a downward trend, including geopolitical tensions in Ukraine and the Middle East, plus a full 2% drop of the S&P 500 in one day (July 31).

A common means of identifying an impending correction is by setting a support level. Support levels are loosely defined as a number that stocks or index values are unlikely to fall below. If a security or index falls to this level, it’s seen as a test. If buyers begin purchasing the stock at this level, then it’s been supported. If there’s no change in buyers—or worse, a continued selloff—the stock has lost support.

These support level numbers are typically taken from “moving averages”—the mean number at which an index has closed over a set time period of 100 or 200 days.

Of course, it’s difficult to target a precise number as a breaking point for a moving average since by definition, the figure changes daily. But in a bull market, the average is steadily increasing—as is the case right now. Regardless, one school of thought holds that if prices fall below their 200-day moving average, it signifies a reversal of an upward trend in the market—in other words, a correction.

Right now, the S&P 500 is 70-80 points higher than its’ 200-day moving average—but as the average creeps higher, it will be interesting to see whether prices will support that figure. When they don’t, it can be the surest sign of an imminent correction.

Market Watch: Wall Street Plays the Waiting Game

0

Tuesday, August 12

Markets started strong Monday, but stagnated over the day as what appeared to be good news on the geopolitical front turned increasingly neutral. Trading was particularly light as investors waited for greater clarity on a variety of geopolitical issues.

Early Monday, Russian President Putin announced his intention to cooperate with Red Cross efforts to send humanitarian aid to Ukraine. But as the day went on, insiders saw few signs of the Russian military pulling back the thousands of troops stationed close to the Ukrainian border.

What’s more, NATO chief Anders Fogh Rasmussen stated he felt there was a ‘high probability’ of the Russian military extending its involvement in the Ukrainian crisis.

In the Middle East, the 72-hour cease fire between Israel and Palestine continued without incident, but there was little evidence of any movement towards a permanent solution.

Overall, Monday saw stocks climb marginally, with the S&P 500 up 0.28% and the Dow up 0.1%. NASDAQ rose 0.7% mainly on the strength of pharmaceuticals.

Monday Closing Bell

Dow Jones Industrial Average:  16569.98 (+0.10)

S&P 500:  1936.92 (+0.28)

NASDAQ: 4401.33 (+0.70)

Economic Watch: The main event for the rest of this week figures to be the reporting of second-quarter earnings for major retailers including Macy’s, WalMart and J.C. Penney. Experts such as Anthony Grisanti of GRZ Energy indicated a subpar performance could be cause for concern.

“If those consumers aren’t strong, if those numbers aren’t strong, I’m a seller,” Grisanti told CNBC.

Meanwhile, the Labor Department will release July’s job opening numbers.

The small business optimism index and monthly Federal Budget statement are also due out today.

Recent Posts

The Impact of Repealing the Glass-Steagall Act

In the leadup to the “Black Tuesday” Stock Market Crash of 1929, and Banking Collapse of 1933, lax financial regulations created an...
retirees returning to work

Study: 40% of Retirees Plan to Return to the Workforce in 2024

In today's society, a significant amount of retirees are finding themselves living at or below the poverty level. This phenomenon is largely...

THIS WILL CHANGE EVERYTHING

Crash Proof Retirement has announced that they have taken a bold step in 2024 by recording and...
The Investment Gender Gap: Women Feel Ignored by Financial Advisors

The Investment Gender Gap: Women Feel Ignored by Financial Advisors

In March, we observe Women’s History Month to recognize and celebrate the vital role that women have played in shaping American history....

Adjusting Your Investment Strategy as You Age

There are three phases that every investor goes through as they make investment decisions during their life. While it would seem logical...

Most Popular

The Impact of Repealing the Glass-Steagall Act

In the leadup to the “Black Tuesday” Stock Market Crash of 1929, and Banking Collapse of 1933, lax financial regulations created an...
retirees returning to work

Study: 40% of Retirees Plan to Return to the Workforce in 2024

In today's society, a significant amount of retirees are finding themselves living at or below the poverty level. This phenomenon is largely...

THIS WILL CHANGE EVERYTHING

Crash Proof Retirement has announced that they have taken a bold step in 2024 by recording and...
The Investment Gender Gap: Women Feel Ignored by Financial Advisors

The Investment Gender Gap: Women Feel Ignored by Financial Advisors

In March, we observe Women’s History Month to recognize and celebrate the vital role that women have played in shaping American history....

Adjusting Your Investment Strategy as You Age

There are three phases that every investor goes through as they make investment decisions during their life. While it would seem logical...